


After a sharp increase in September, Canada’s mover market changed direction again in October.
A total of 54,699 mover households were identified nationwide, down from 64,569 in September — a decrease of 9,870 households, or 15.3% month over month.
The decline reversed much of September’s 19.1% increase, bringing national activity back toward the levels recorded during the summer.
But the slowdown was not universal.
While Canada’s four largest provincial mover markets all recorded declines, New Brunswick, Newfoundland and Labrador, and Prince Edward Island moved higher.
October’s results highlight how quickly national mover activity can shift — and why the longer-term trend and provincial differences deserve closer attention
October Returns to Familiar Summer Levels
September had broken away from the relatively stable mover volumes recorded during June, July, and August.
October brought activity back into that earlier range.
Looking at the past 13 months helps put this movement into perspective.
Canada’s New Mover Activity
13-Month Rolling Trend
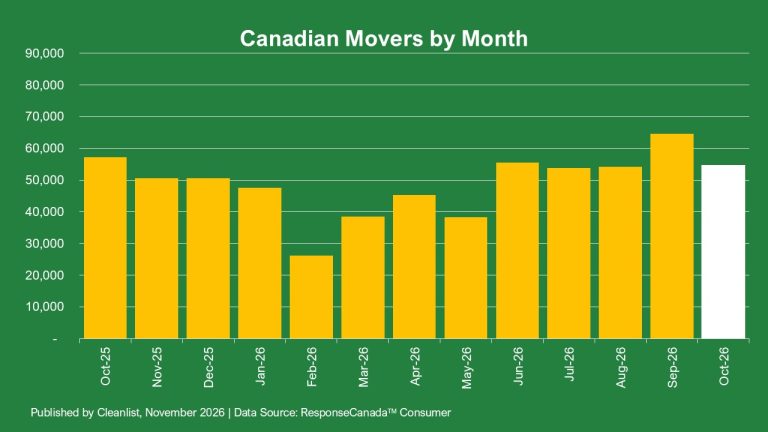
The graph shows considerable month-to-month variation in mover activity over the past year.
After recording 57,225 mover households in October 2025, activity declined toward the end of the year before fluctuating through the early months of 2026.
Mover activity then strengthened during the summer, with June, July, and August each recording approximately 54,000 to 56,000 households.
September’s 64,569 households marked the highest monthly volume of 2026, before October returned to 54,699.
Although October’s total was substantially below September, it remained slightly above both August and July.
This suggests that September’s surge was not sustained into October, but national mover activity returned to a range already observed earlier in the year rather than falling to a new low.
The year-over-year comparison offers another perspective.
October 2025 recorded 57,225 mover households, putting October 2026 approximately 4.4% lower than the same month last year.
The 13-month trend therefore points to a market characterized by fluctuating monthly volumes rather than a consistent upward or downward trajectory.
Canada’s Four Largest Mover Markets All Declined
The national slowdown was driven largely by decreases across Canada’s biggest provincial markets:
- Ontario: 25,118 (-13.2% MoM)
- Quebec: 8,109 (-31.9% MoM)
- British Columbia: 9,309 (-11.7% MoM)
- Alberta: 7,365 (-8.2% MoM)
Ontario remained Canada’s largest mover market, accounting for approximately 46% of all mover households identified nationally.
However, its three-month growth streak ended in October, with activity declining by 3,825 households from September.
British Columbia also moved lower after September’s nearly 50% increase. Its October volume of 9,309 households nevertheless remained above the levels recorded in July and August.
Alberta experienced a more moderate decline of approximately 8%, returning to a volume similar to August.
The most significant percentage decrease among the major markets came from Quebec.
After increasing nearly 34% in September, Quebec mover activity fell approximately 32% in October, from 11,915 to 8,109 households.
Quebec’s decline alone accounted for approximately 39% of the national month-over-month decrease.
These changes demonstrate how movements in a few large provincial markets can substantially influence the national total.
Atlantic Canada Provides a Different Story
Despite declines across Canada’s four largest markets, October was not uniformly negative.
Three Atlantic provinces recorded increases:
- New Brunswick: +29.6%
- Prince Edward Island: +15.8%
- Newfoundland and Labrador: +2.1%
New Brunswick recorded the strongest percentage increase nationwide, rising from 947 households in September to 1,227 in October.
Prince Edward Island also moved higher, although its smaller household count means percentage changes should be interpreted in the context of a relatively limited market.
Newfoundland and Labrador posted a modest increase, continuing the upward movement recorded in September.
Nova Scotia, meanwhile, declined approximately 21.8%, showing that even provinces within the same region can follow different monthly patterns.
Elsewhere, Manitoba recorded a decrease of approximately 20.2%, while Saskatchewan declined by 12.3%.
The broader picture is therefore one of national contraction accompanied by localized growth.
For organizations targeting specific provinces, those regional differences may be more relevant than the national percentage change alone.
Why Regional Mover Trends Matter for Marketers
Recently relocated households represent an audience entering a new phase of purchasing and service decisions.
Moving often involves more than changing addresses. Consumers may be establishing relationships with new local businesses, arranging household services, purchasing furniture, or reconsidering existing providers.
These opportunities can involve:
- Furniture, appliances, and home furnishings
- Internet and telecommunications
- Insurance and financial services
- Home improvement and maintenance
- Security and household services
- Local retailers and service providers
October added 54,699 recently relocated households to the identified Canadian mover audience.
Although that figure was lower than September’s, it still represents a substantial group of consumers potentially adjusting to new homes and neighbourhoods.
For organizations using a Canadian Consumer Database New Mover Household Mailing List, the ability to target by geography and relocation timing can help align campaigns with these changing needs.
October’s results also reinforce the importance of looking beyond national totals.
While Ontario, Quebec, British Columbia, and Alberta experienced lower mover activity, New Brunswick and other Atlantic markets recorded increases.
Understanding these differences can help marketers assess audience availability, adjust regional campaign priorities, and plan outreach based on current household movement.
Bottom Line
Canada’s mover market cooled in October after September’s strong performance.
A total of 54,699 mover households were identified nationwide, representing a 15.3% month-over-month decline and a 4.4% decrease from October 2025.
The 13-month trend shows that October’s volume returned to levels similar to those recorded during the summer, following September’s unusually strong performance.
The decline was concentrated in Canada’s largest markets, particularly Ontario and Quebec, with Quebec experiencing the steepest percentage decrease among the four.
But the national slowdown did not extend everywhere.
New Brunswick, Prince Edward Island, and Newfoundland and Labrador all recorded increases, demonstrating that regional opportunities can emerge even when overall market activity moves lower.
For marketers, October’s takeaway is not simply that fewer Canadian households moved than in September.
It’s that the geographic distribution of mover opportunities continues to change, making timely regional data an important consideration when planning acquisition campaigns.
📊Leverage Cleanlist’s New Mover Data
Cleanlist’s New Mover dataset is Canada’s most comprehensive, continuously updated source of verified move activity. With Cleanlist, you can:
Target movers by geography, household profile, or precise move timing
Align outreach with critical post-move decision windows
Improve campaign accuracy and ROI using high-quality, AI-ready data
📩 Want mover data for your area?
Cleanlist offers a free personalized data discovery report to help you see exactly how many movers are available in your target market — and how you can put that insight to work.