


After showing signs of stability in September, Canada’s pre-mover market experienced a significant slowdown in October.
A total of 49,136 pre-mover households were identified nationwide, down from 57,442 in September. That represents a decline of 8,306 households, or 14.5% month over month.
The decrease was widespread, with nine of Canada’s ten provinces reporting lower activity.
Yet one major market moved in the opposite direction.
Quebec was the only province to record an increase in October, highlighting how regional pre-mover activity can diverge even during a broad national slowdown.
October’s Decline Fits a Broader Seasonal Pattern
September had briefly interrupted the downward trend that followed Canada’s spring pre-mover peak.
October brought another decline, but looking at the past 13 months provides useful context.
Canada’s Pre-Mover Activity
13-Month Rolling Trend
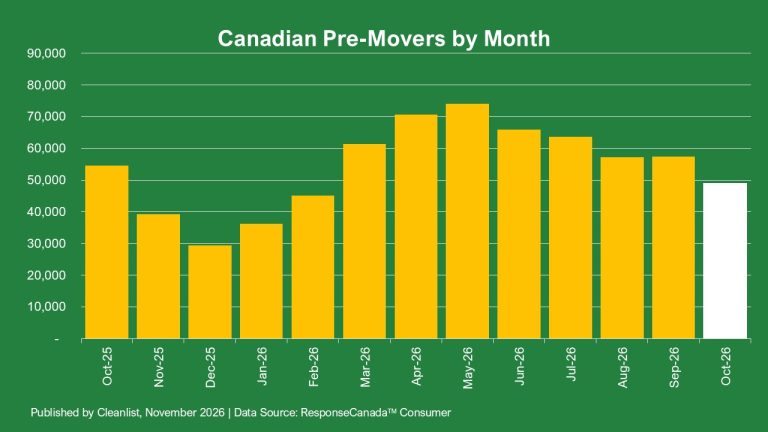
The data shows a recurring pattern of lower activity toward the end of the year, followed by a recovery through the winter and spring.
Pre-mover activity reached 74,010 households in May 2026, the highest monthly volume recorded so far this year.
Since then, volumes have generally moved lower, with September providing a brief period of stability before October’s decline.
At 49,136 households, October was approximately 34% below May’s peak.
However, it remained approximately 36% above January 2026, when 36,137 pre-mover households were identified.
The year-over-year comparison also provides perspective.
October 2025 recorded 54,529 households, putting October 2026 approximately 9.9% lower than the same month last year.
The historical pattern suggests that seasonal changes may contribute to October’s slowdown, although the year-over-year decline indicates that current activity is also below last year’s comparable level.
For marketers, the distinction matters: a seasonal reduction in the available audience does not necessarily mean that opportunities have disappeared.
Canada’s Largest Pre-Mover Markets Take Different Paths
Canada’s four largest provincial pre-mover markets continued to account for most national activity in October:
- Ontario: 22,774 (-18.7% MoM)
- Quebec: 10,736 (+0.5% MoM)
- British Columbia: 6,264 (-18.1% MoM)
- Alberta: 5,446 (-11.7% MoM)
Ontario remained Canada’s largest pre-mover market, representing approximately 46% of the national total.
However, it also experienced the largest absolute decline, with 5,239 fewer households identified than in September.
British Columbia fell approximately 18% after its September rebound, while Alberta declined nearly 12%.
Quebec, meanwhile, remained relatively stable.
Its pre-mover count increased slightly from 10,687 in September to 10,736 in October.
Although the increase was modest, Quebec’s performance stands out against the declines recorded elsewhere.
The province accounted for approximately 22% of Canada’s October pre-mover households, compared with roughly 19% in September.
This illustrates why national totals alone may not provide enough detail for geographically targeted campaigns.
Nine Provinces Declined, but Not Equally
October’s slowdown extended across most of Canada, although the magnitude of the decline varied considerably.
The largest percentage decreases were recorded in:
- Manitoba: -38.9%
- Prince Edward Island: -27.7%
- Nova Scotia: -21.3%
- Ontario: -18.7%
- British Columbia: -18.1%
Saskatchewan also declined approximately 18%, while Alberta fell nearly 12%.
Newfoundland and Labrador and New Brunswick experienced more moderate decreases of approximately 7% and 4%, respectively.
Quebec’s 0.5% increase was the only positive provincial result.
These differences highlight two distinct dimensions of market activity.
Ontario experienced the largest reduction in actual household count, while Manitoba recorded the steepest percentage decline.
For organizations targeting specific regions, both measures can be useful when evaluating audience size and changes in available opportunities.
What October’s Slowdown Means for Marketers
Moving creates a relatively short period when households may be reconsidering existing purchasing decisions and preparing for new household needs.
Internet and telecommunications services, insurance, home improvement, financial products, utilities, furniture, appliances, security services, and other household purchases can all come into consideration before a relocation is complete.
October identified another 49,136 pre-mover households across Canada.
Although the audience was smaller than in September, it still represents a substantial group of consumers preparing for a change in residence.
Because these households are identified as pre-movers, marketers have an opportunity to engage them while relocation-related decisions may still be taking shape.
A Canadian consumer database pre-mover mailing list can also support geographically targeted campaigns.
That becomes particularly relevant during months like October, when national activity declines but individual provincial markets behave differently.
For marketers, understanding where pre-mover households are being identified can help inform campaign timing, geographic targeting, and audience planning.
Bottom Line
October marked a return to declining activity in Canada’s pre-mover market.
A total of 49,136 households were identified nationwide, representing a 14.5% decrease from September and approximately 9.9% fewer households than October 2025.
The 13-month trend places the decline within a broader pattern of stronger spring activity followed by lower volumes later in the year.
However, October’s results also reveal considerable regional differences.
Quebec was the only province to record an increase, while Ontario experienced the largest absolute decline and Manitoba recorded the steepest percentage decrease.
For marketers, the takeaway is not simply that Canada’s pre-mover audience became smaller in October.
It’s that the timing and geographic distribution of these opportunities continue to change, reinforcing the value of current data when planning acquisition campaigns.
📊 Leverage Cleanlist’s Pre-Mover Data
Cleanlist’s Pre-Mover dataset identifies households preparing to relocate — often weeks or months before the move occurs. With Cleanlist, you can:
- Target pre-movers by geography and household characteristics
- Reach consumers before competitors saturate the market
- Align messaging with peak decision-making timing
👉 Cleanlist offers self-service opportunity counts to help you size the market. See our consumer data page to explore available segments and activation options.